7.3.1.4. Exercise: Filtering EMG data#
Using this dataset with one surface EMG electrode on the biceps brachii:
import kineticstoolkit.lab as ktk
import numpy as np

filename = ktk.doc.download("emg_biceps_brachii.ktk.zip")
emg = ktk.load(filename)
emg.plot()
Write code that generates new data named “Envelope” in the TimeSeries, which corresponds to the envelope of this signal. Follow these three steps:
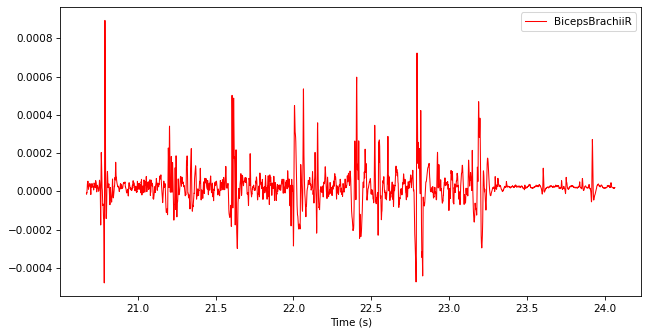
Filter the TimeSeries with a band-pass Butterworth filter from 20 Hz to 500 Hz to reject high-frequency noise and body movement artifacts.
Show code cell content
filtered_emg = ktk.filters.butter(emg, btype="bandpass", fc=[20, 500])
filtered_emg.plot()
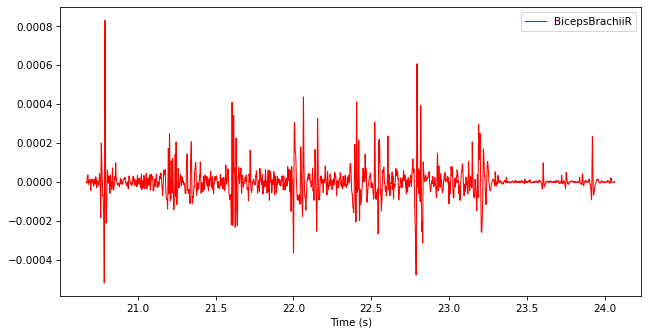
Rectify the filtered TimeSeries by replacing every data point with its absolute value. You may use np.abs.
Show code cell content
filtered_emg.data["BicepsBrachiiR"] = np.abs(filtered_emg.data["BicepsBrachiiR"])
filtered_emg.plot()
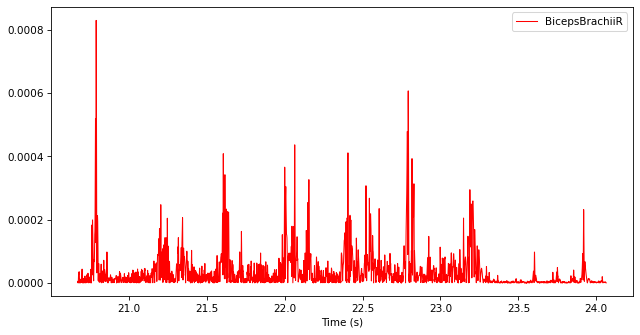
Filter the rectified TimeSeries with a low-pass Butterworth filter with a cut-off frequency of 10 Hz.
Show code cell content
filtered_emg = ktk.filters.butter(filtered_emg, fc=10)
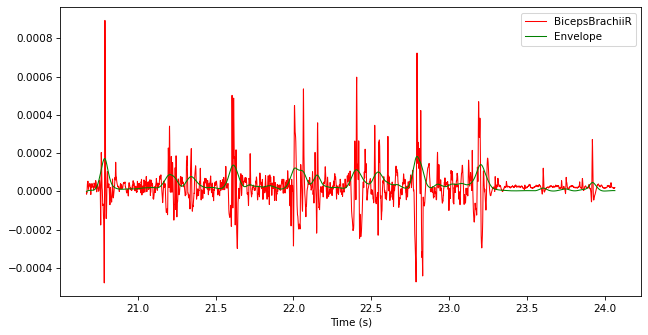
# Add the filtered signal as Envelope in the original TimeSeries
# There are many ways to do this, here is a robust one:
filtered_emg = filtered_emg.rename_data("BicepsBrachiiR", "Envelope")
emg = emg.merge(filtered_emg)
# Plot the result
emg.plot()