4.3. Plotting multiple series#
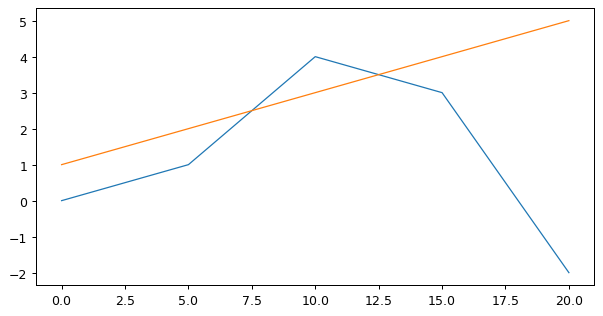
Many series can be plotted on the same figure, simply by calling plt.plot multiple times:
import matplotlib.pyplot as plt

x = [0.0, 5.0, 10.0, 15.0, 20.0]
y1 = [0.0, 1.0, 4.0, 3.0, -2.0]
y2 = [1.0, 2.0, 3.0, 4.0, 5.0]

plt.plot(x, y1)
plt.plot(x, y2);
By default, any new plot is added to the same figure. To generate new figures, you may use the following functions:
plt.figure prepares a new, empty figure that will be used for each subsequent plot, leaving the original one intact.
plt.clf clears the current figure.