4.6. Markers, line style and colour#
The optional, third argument fmt of the plt.plot function defines optional markers, line styles and line colours. This argument is a string composed of these characters:
4.6.1. Marker#
.dotoroundxcross (x)+cross (+)^triangleddiamondssquare
By default, no marker is plotted.
4.6.2. Line style#
-full line--dashed line-.dash-dotted line:dotted line
Default is a full line, unless a marker has been set, in which case the default is no line.
4.6.3. Colour#
rredggreenbblueccyanmmagentaydark yellowwwhitekblack
Default is the next colour in the current colour cycle.
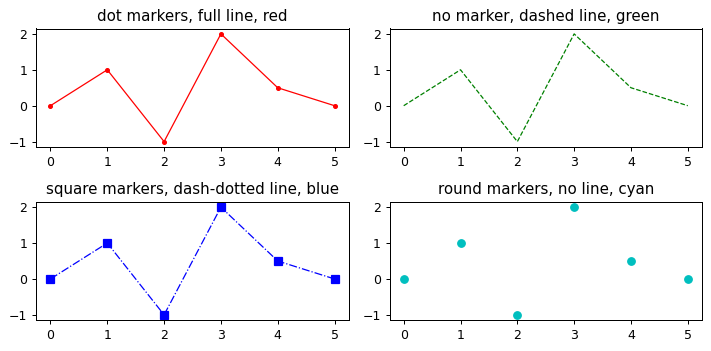
Here are some examples:
import matplotlib.pyplot as plt

y = [0.0, 1.0, -1.0, 2.0, 0.5, 0.0]

plt.subplot(2, 2, 1)
plt.plot(y, ".-r")
plt.title("dot markers, full line, red")

plt.subplot(2, 2, 2)
plt.plot(y, "--g")
plt.title("no marker, dashed line, green")

plt.subplot(2, 2, 3)
plt.plot(y, "s-.b")
plt.title("square markers, dash-dotted line, blue")

plt.subplot(2, 2, 4)
plt.plot(y, "oc")
plt.title("round markers, no line, cyan")

plt.tight_layout()