5.8.1. Exercise: Comparisons#
We recorded this series of vertical forces using a gait force platform:
import numpy as np

force = np.array(
    [
        17.61, 21.42, 17.61, 17.61, 17.61, 32.85, 25.23, 17.61, 29.04, 32.85,
        25.23, 21.42, 67.14, 810.0, 870.95, 802.38, 726.19, 775.71, 947.14,
        985.23, 954.76, 863.33, 783.33, 676.66, 520.47, 295.71, 150.95, 48.09,
        -1.42, 2.38, 17.61, 2.38, 6.19, 6.19, 6.19, 2.38, 6.19, 13.80,
    ]
)

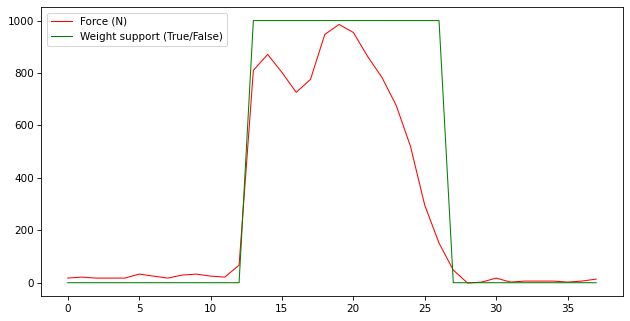
We want to identify the weight support phase, defined as any sample where the force is higher than 100 newtons.
Write a one-line code that creates a NumPy array named
is_weight_support, which has the same shape asforceand that containsTrueduring the weight support phase, andFalseotherwise.Verify your code by plotting both
forceandis_weight_supporton the same figure.
Show code cell content
import matplotlib.pyplot as plt

# We create a mask to keep only the weight support phase
is_weight_support = force > 100

# Verify
plt.plot(force, label="Force (N)")
plt.plot(is_weight_support * 1000, label="Weight support (True/False)")
plt.legend();

# Note that we plotted (is_weight_support * 1000) instead of
# is_weight_support to match the vertical scale of the force plot
# so that the comparison is more visible on the figure.