5.10. Indexing and slicing one-dimensional arrays#
Indexing and slicing a one-dimensional array is identical to indexing and slicing a Python list.
Tip
As a reminder:
Indexing means accessing one element using an index:
the_array[2]Slicing means accessing several elements using a slice:
the_array[0:3]
Throughout this section, we will work with two example arrays:
data: some random data;time: the corresponding time.
import numpy as np
import matplotlib.pyplot as plt
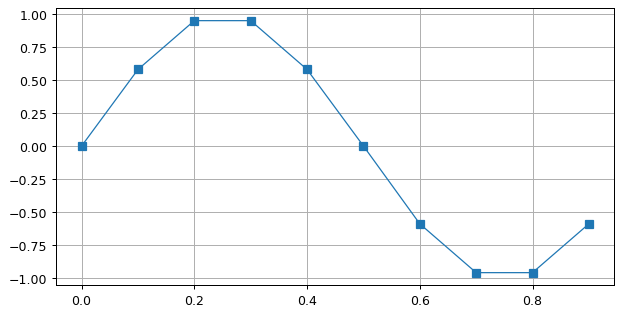
data = np.array([0.0, 0.58, 0.95, 0.95, 0.58, 0.0, -0.59, -0.96, -0.96, -0.59])
time = np.arange(10) / 10
plt.plot(time, data, "s-")
plt.grid(True);
As mentioned above, indexing a one-dimensional array is identical to indexing a list. To read one element of a list/array:
data[2] # Read the 3rd element
0.95
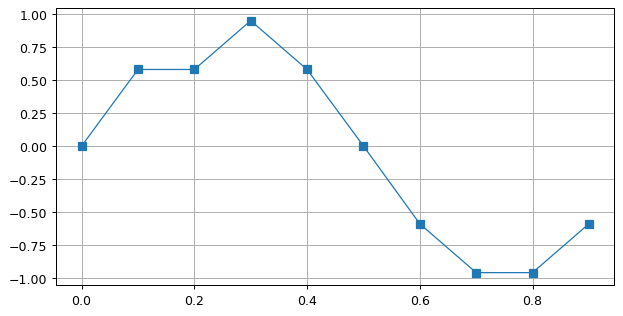
To write one element of a list/array:
data[2] = 0.58  # Assign 0.35 to the 3rd element

# Plot the result
plt.plot(time, data, "s-")
plt.grid(True)

data[2] = 0.95  # Reset to its original value
Negative indexing also works:
# Read the last data
data[-1]
-0.59
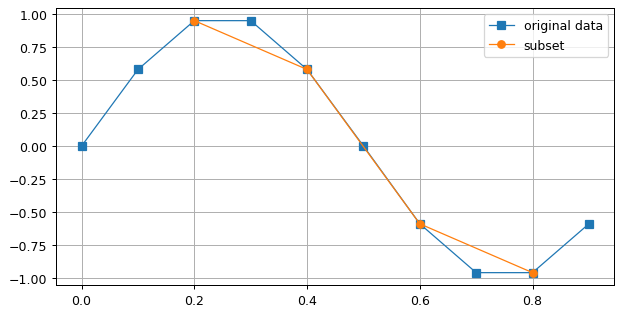
Slicing a one-dimensional array is identical to slicing a list. To read several elements of a list/array:
# Keep only the values at indexes 2, 4, 6 and 8 of the original array
# Start at 2 (incl.), up to 9 (excl.) by steps of 2:
data_subset = data[2:9:2]
time_subset = time[2:9:2]

# Plot the result
plt.plot(time, data, "s-", label="original data")
plt.plot(time_subset, data_subset, "o-", label="subset")
plt.grid(True)
plt.legend();
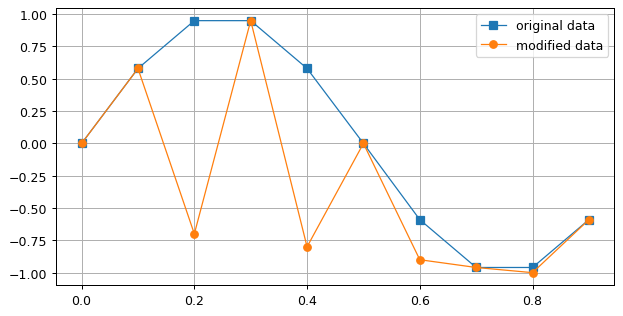
To write several elements of a list/array:
# Replace values at indexes 2, 4, 6, 8 of the original list/array by
# [-0.7, -0.8, -0.9, -1.0]

modified_data = data.copy()
modified_data[2:9:2] = [-0.7, -0.8, -0.9, -1.0]

# Plot the result
plt.plot(time, data, "s-", label="original data")
plt.plot(time, modified_data, "o-", label="modified data")
plt.grid(True)
plt.legend();
Tip
Note the line:
modified_data = data.copy()
Using the copy method is required here, because otherwise we are just telling Python to assign an additional name (modified_data) to the same variable (data). In this case, modifying modified_data would also modify data since they are both the same array. Using the copy method creates a new, unique array so that modifying one won’t modify the other.