5.11.3. Exercise: Indexing/slicing/filtering one-dimensional arrays 3#
You have recorded a noisy signal:
signal = np.array(
    [
        0.436, 0.493, 0.467, 0.467, 0.482, 0.497, 0.474, 0.493, 0.474, 0.467,
        0.470, 0.455, 0.482, 0.501, 0.470, 0.482, 0.467, 0.467, 0.558, 0.413,
        0.463, 0.444, 0.463, 0.417, 0.528, 0.455, 0.486, 0.459, 0.490, 0.459,
    ]
)
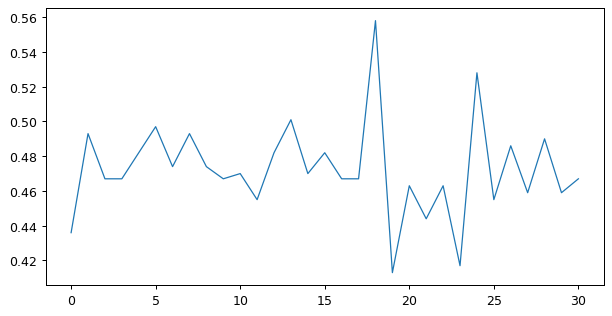
You want to smooth this signal using a moving average with a window of three samples. This means creating a new array where each value is the average of the three neighbour values of the raw signal, as illustrated in Fig. 5.10.

Fig. 5.10 Filtering using a moving average.#
Using only one line, apply this filter to the raw, noisy signal. Then, plot both the raw and filtered signals on the same figure to verify your result.
Show code cell content
import numpy as np
import matplotlib.pyplot as plt


filtered = (signal[0:-2] + signal[1:-1] + signal[2:]) / 3

plt.plot(signal, label="raw")
plt.plot(filtered, label="filtered")
plt.legend();
