7.1. The TimeSeries type#
A TimeSeries is a single container that hold time, data, events and general info.
7.1.1. Time and data#
A TimeSeries in its simplest form contains a time attribute and some data. For example:
import kineticstoolkit.lab as ktk
import numpy as np
import pandas as pd
import matplotlib.pyplot as plt

ts = ktk.TimeSeries()                     # Create an empty TimeSeries
ts.time = np.arange(0, 10, 0.1)           # Assign time
ts.data["Sinus"] = np.sin(ts.time)        # Add a data series
ts.data["Cosinus"] = np.cos(ts.time)      # Add another data series
ts.data["SquareRoot"] = np.sqrt(ts.time)  # Add yet another data series

ts
TimeSeries with attributes:
      time: <array of shape (100,)>
      data: <dict with 3 entries>
    events: []
      info: {'Time': {'Unit': 's'}}
We can also add data to a TimeSeries using its add_data method. This method checks that each data series has the same number of samples, whereas assigning it directly to data (as above) does not perform such verification.
ts = ktk.TimeSeries()                             # Create an empty TimeSeries
ts.time = np.arange(0, 10, 0.1)                   # Assign time
ts = ts.add_data("Sinus", np.sin(ts.time))        # Add a data series
ts = ts.add_data("Cosinus", np.cos(ts.time))      # Add another data series
ts = ts.add_data("SquareRoot", np.sqrt(ts.time))  # Add yet another data series

ts
TimeSeries with attributes:
      time: <array of shape (100,)>
      data: <dict with 3 entries>
    events: []
      info: {'Time': {'Unit': 's'}}
To see the TimeSeries data:
ts.data
{
         'Sinus': <array of shape (100,)>
       'Cosinus': <array of shape (100,)>
    'SquareRoot': <array of shape (100,)>
}
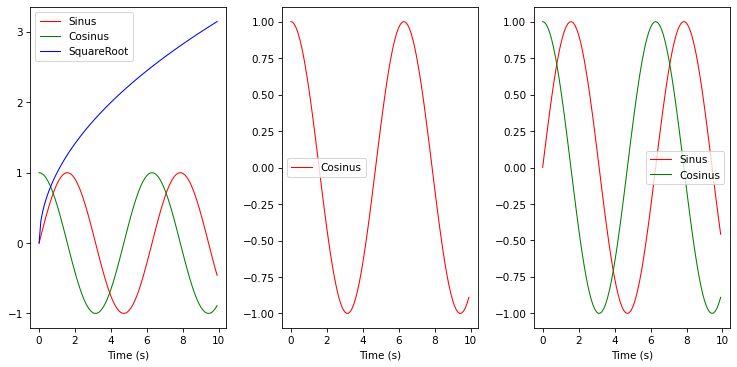
TimeSeries can be plotted directly using Matplotlib, and we can also specify which of the series to plot.
plt.subplot(1, 3, 1)
ts.plot()

plt.subplot(1, 3, 2)
ts.plot("Cosinus")

plt.subplot(1, 3, 3)
ts.plot(["Sinus", "Cosinus"])

plt.tight_layout()
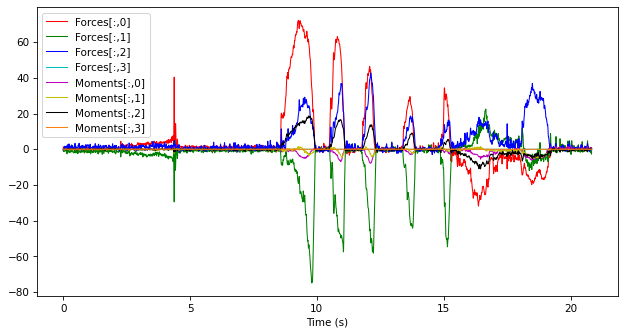
A TimeSeries can also contain multidimensional data, as long as the first dimension corresponds to time. For instance, this dataset of wheelchair propulsion kinetics expresses forces and moments as Nx4 series of vectors:
ts = ktk.load(ktk.doc.download("kinetics_wheelchair_propulsion.ktk.zip"))

ts.data
{
     'Forces': <array of shape (5000, 4)>
    'Moments': <array of shape (5000, 4)>
}
ts.plot()
7.1.2. Events#
In the figure above, we see that the TimeSeries contains cyclic data. These cycles could be delimited using events. There are several ways to edit the events of a TimeSeries, which will be presented later in section Event management. For now, we will add the events manually using ktk.TimeSeries.add_event:
ts = ts.add_event(8.56, "push")
ts = ts.add_event(9.93, "recovery")
ts = ts.add_event(10.50, "push")
ts = ts.add_event(11.12, "recovery")
ts = ts.add_event(11.78, "push")
ts = ts.add_event(12.33, "recovery")
ts = ts.add_event(13.39, "push")
ts = ts.add_event(13.88, "recovery")
ts = ts.add_event(14.86, "push")
ts = ts.add_event(15.30, "recovery")
These 10 events are now added to the TimeSeries’ list of events:
ts.events
[TimeSeriesEvent(time=8.56, name='push'),
 TimeSeriesEvent(time=9.93, name='recovery'),
 TimeSeriesEvent(time=10.5, name='push'),
 TimeSeriesEvent(time=11.12, name='recovery'),
 TimeSeriesEvent(time=11.78, name='push'),
 TimeSeriesEvent(time=12.33, name='recovery'),
 TimeSeriesEvent(time=13.39, name='push'),
 TimeSeriesEvent(time=13.88, name='recovery'),
 TimeSeriesEvent(time=14.86, name='push'),
 TimeSeriesEvent(time=15.3, name='recovery')]
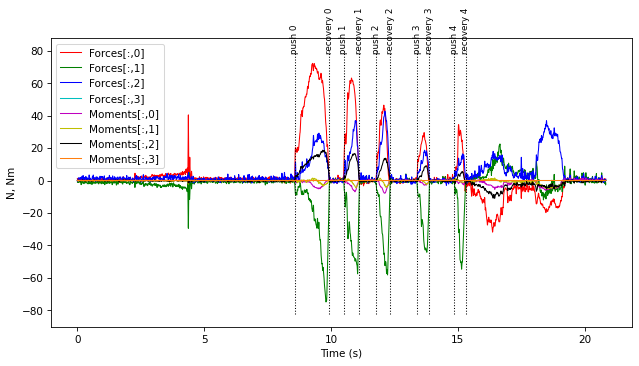
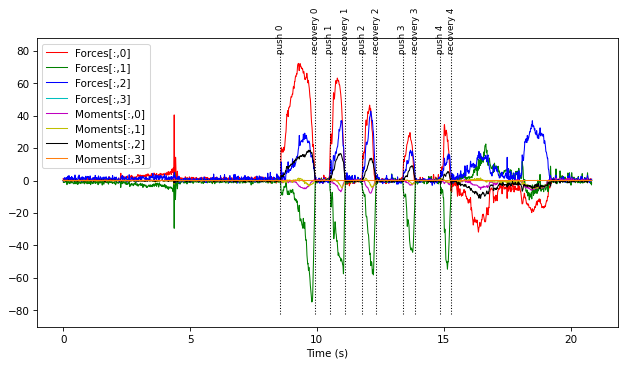
If we plot the TimeSeries again, we can see the added events.
ts.plot()
7.1.3. Info#
The TimeSeries’ info attribute contains metadata such as units and other information. This dictionary is addressed using two nested keys: the first (outer) one is generally what the information refers to (e.g., “Time”, “Forces”, “LateralFemoralEpicondyleR”, “Speed”), and the second (inner) one defines the nature of the information (e.g., “Unit”, “Date”, “Name”).
By default, info includes the time unit:
ts.info
{
    'Time': {'Unit': 's'}
}
You may use the ktk.TimeSeries.add_info, ktk.TimeSeries.rename_info and ktk.TimeSeries.remove_info to manage info:
ts = ts.add_info("Forces", "Unit", "N")
ts = ts.add_info("Moments", "Unit", "Nm")

ts.info
{
       'Time': {'Unit': 's'}
     'Forces': {'Unit': 'N'}
    'Moments': {'Unit': 'Nm'}
}
Unless explicitly mentioned, metadata is not used for calculation and is strictly optional. “Unit” info is however used by ktk.TimeSeries.plot to plot the units:
ts.plot()