7.2.4. Event management#
This section shows how to use these methods for event management:
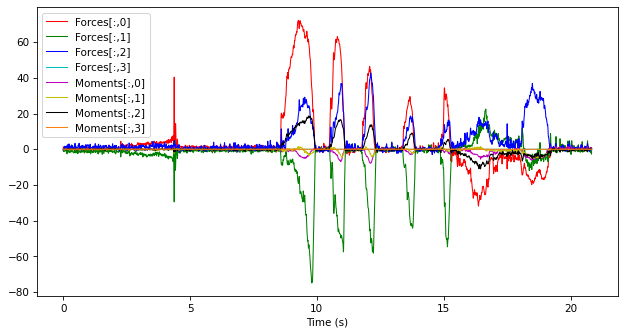
We will use this TimeSeries that contains cyclic kinetic data in wheelchair propulsion:
import kineticstoolkit.lab as ktk
import matplotlib.pyplot as plt

ts = ktk.load(ktk.doc.download("kinetics_wheelchair_propulsion.ktk.zip"))
ts.plot()
7.2.4.1. Adding events#
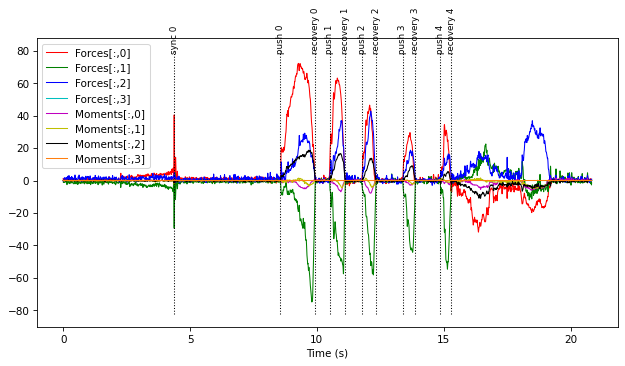
We already know how to manually add events using ktk.TimeSeries.add_event:
ts = ts.add_event(4.37, "sync")
ts = ts.add_event(8.56, "push")
ts = ts.add_event(9.93, "recovery")
ts = ts.add_event(10.50, "push")
ts = ts.add_event(11.12, "recovery")
ts = ts.add_event(11.78, "push")
ts = ts.add_event(12.33, "recovery")
ts = ts.add_event(13.39, "push")
ts = ts.add_event(13.88, "recovery")
ts = ts.add_event(14.86, "push")
ts = ts.add_event(15.30, "recovery")

ts.plot()
7.2.4.2. Counting the number of occurrences of an event#
Each event is defined by its name, and if it is repeated multiple times, by an occurrence. To count these occurrences, we use ktk.TimeSeries.count_events:
print(ts.count_events('sync'), "occurrences of event 'sync'")
print(ts.count_events('push'), "occurrences of event 'push'")
print(ts.count_events('recovery'), "occurrences of event 'recovery'")
1 occurrences of event 'sync'
5 occurrences of event 'push'
5 occurrences of event 'recovery'
7.2.4.3. Renaming events#
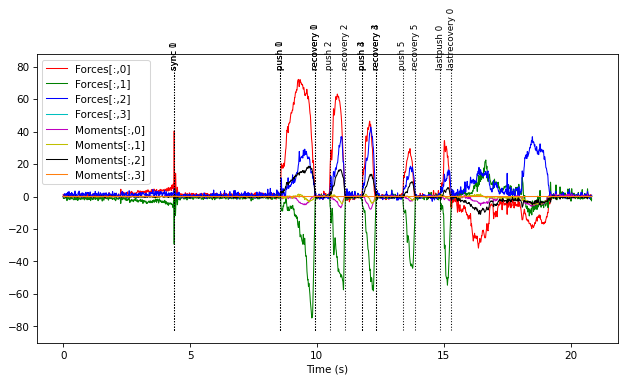
Renaming events is performed using ktk.TimeSeries.rename_event:
ts = ts.rename_event("push", "lastpush", occurrence=4)
ts = ts.rename_event("recovery", "lastrecovery", occurrence=4)

ts.plot()

7.2.4.4. Removing events#
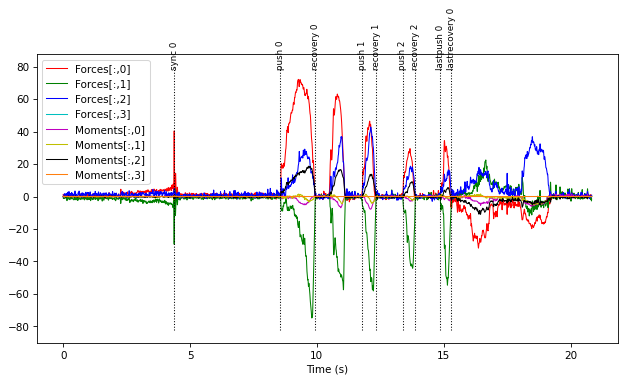
To remove an occurrence of an event, we use ktk.TimeSeries.remove_event. For instance, to remove the second push cycle:
ts = ts.remove_event("push", occurrence=1)
ts = ts.remove_event("recovery", occurrence=1)

ts.plot()
7.2.4.5. Removing duplicate events#
It may happen that events get duplicated in a TimeSeries. For instance, we may have added some events twice:
ts = ts.add_event(4.37, "sync")
ts = ts.add_event(8.56, "push")
ts = ts.add_event(9.93, "recovery")
ts = ts.add_event(10.50, "push")
ts = ts.add_event(11.12, "recovery")
ts = ts.add_event(11.78, "push")
ts = ts.add_event(12.33, "recovery")

ts.plot()
Note the superposition of occurrences on the first events. To remove the duplicate events, we use ktk.TimeSeries.remove_duplicate_events:
ts = ts.remove_duplicate_events()
ts.plot()
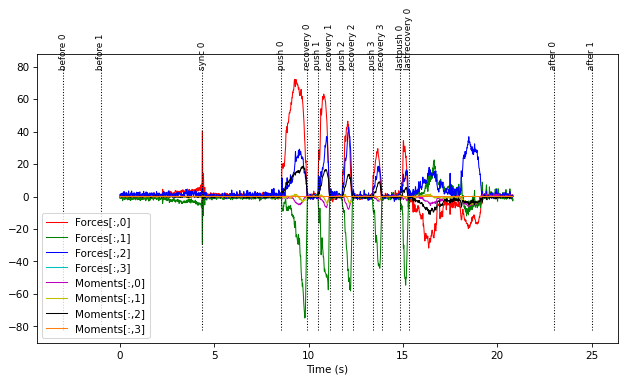
7.2.4.6. Trimming events#
For some reasons, it may happen that a TimeSeries have events outside its time array. Let’s simulate this situation:
ts = ts.add_event(-3.0, "before")
ts = ts.add_event(-1.0, "before")
ts = ts.add_event(23.0, "after")
ts = ts.add_event(25.0, "after")

ts.plot()
To remove any event that is outside the TimeSeries’ time array, we use ktk.TimeSeries.trim_events.
ts = ts.trim_events()
ts.plot()
7.2.4.7. Editing events interactively#
Finally, it is possible to edit the events interactively, using ktk.TimeSeries.ui_edit_events. This allows to add, remove and move events by clicking on a figure.
Note
Matplotlib must be interactive. See section Installing and configuring Spyder do help.
ts = ts.ui_edit_events()
which creates the interactive windows shown in Fig. 7.1 and Fig. 7.2.

Fig. 7.1 Interactive figure created by ktk.TimeSeries.ui_edit_events#

Fig. 7.2 Interactive menu created by ktk.TimeSeries.ui_edit_events#