5.3.1. Exercise: Arithmetics#
A ball is released from a point in the air. Knowing that it was immobile when released, and that it gains negative speed at a rate of 9.81 m/s², plot its velocity as shown in Fig. 5.5 for one second after release.
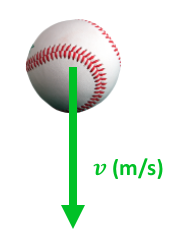
Fig. 5.5 Vertical velocity of a falling ball.#
Tip
Start by creating a time array using np.arange or np.linspace. Then, use this time array to create a velocity array. Finally, plot the velocity as a function of time.
Show code cell content
import numpy as np
import matplotlib.pyplot as plt


# First, let's define a time array
t = np.linspace(0, 1, 100, endpoint=False)

# Calculate the velocity as -9.81 * t
v = -9.81 * t

# Show it
plt.plot(t, v)
plt.xlabel("Time (s)")
plt.ylabel("Velocity (m/s)")
plt.grid(True)
plt.show()
